The Competitors tab in Advertising Research from the Advertising Toolkit helps you identify who else is bidding for attention in the same paid search auctions. While the Positions and Position Changes tabs show how ads perform, this view reveals which domains are actively competing against you for visibility.
Use this report to:
- Discover new paid search competitors you may not have spotted
- Identify which advertisers share the most keyword overlap with you
- Prioritize which domains to analyze further based on their reach, spend, and focus
To get started:
- Open the Advertising Research tool in the left-hand Semrush menu.
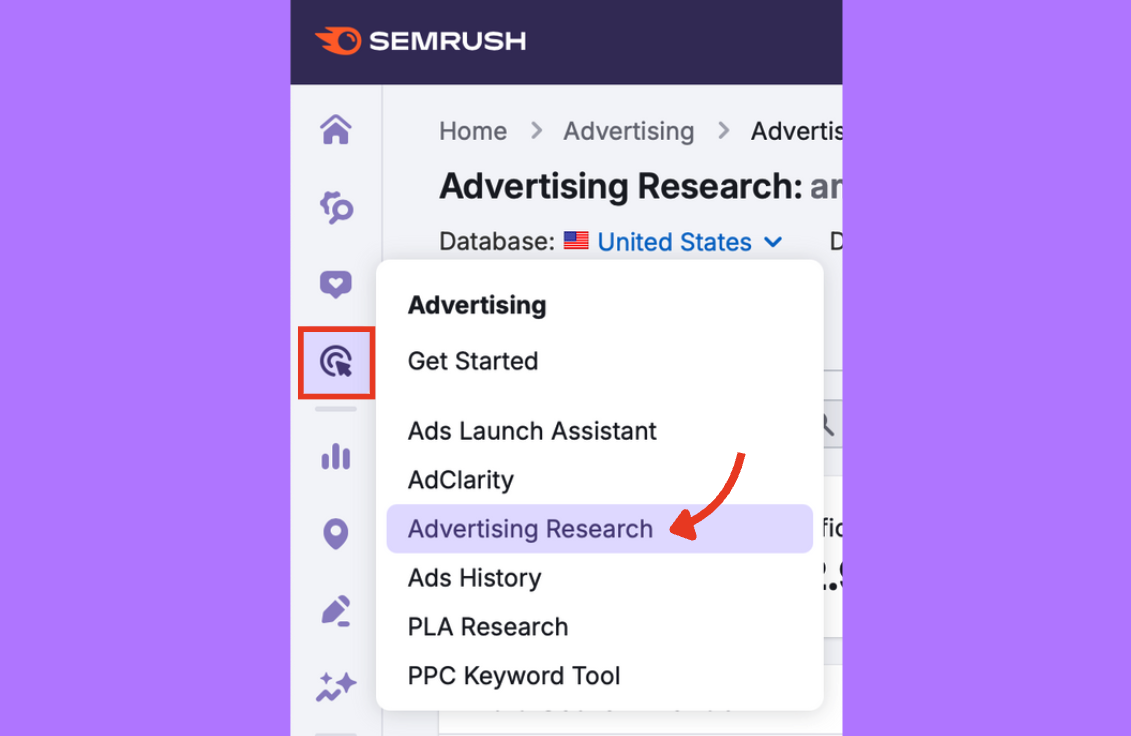
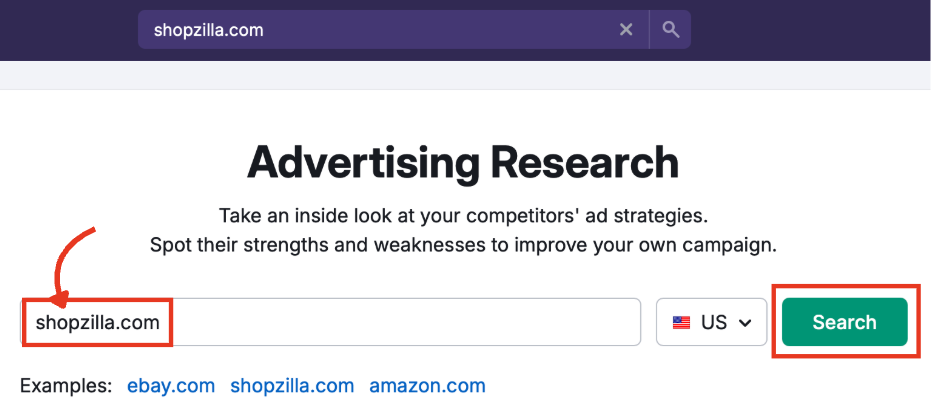
- Enter your domain (or a competitor’s) in the main search bar.
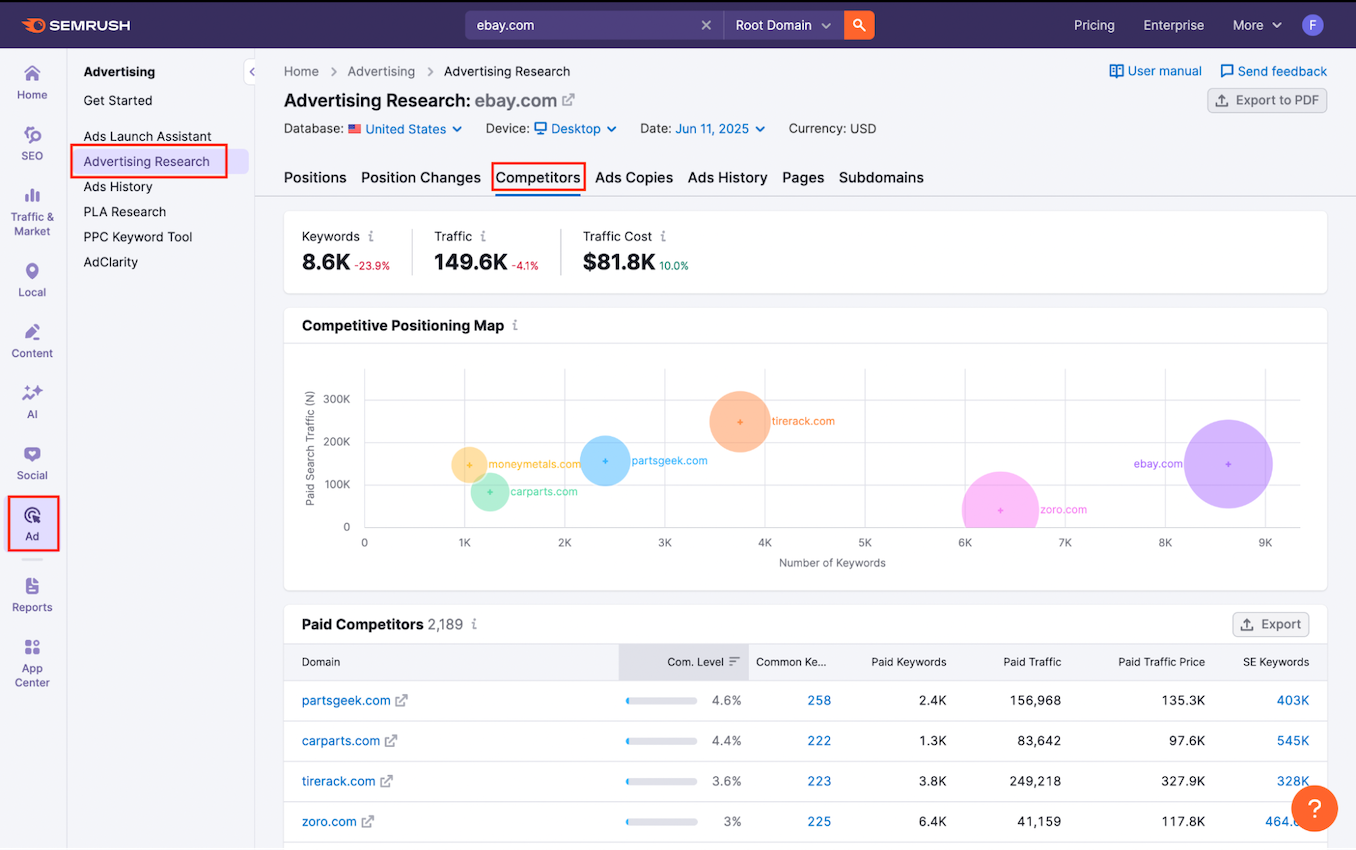
- Click the Competitors tab.

Step 1: Set Up Your View
Before reading the report, review the parameters at the top of the dashboard to make sure you're looking at the most relevant data.
Database
Choose the country you want to analyze.
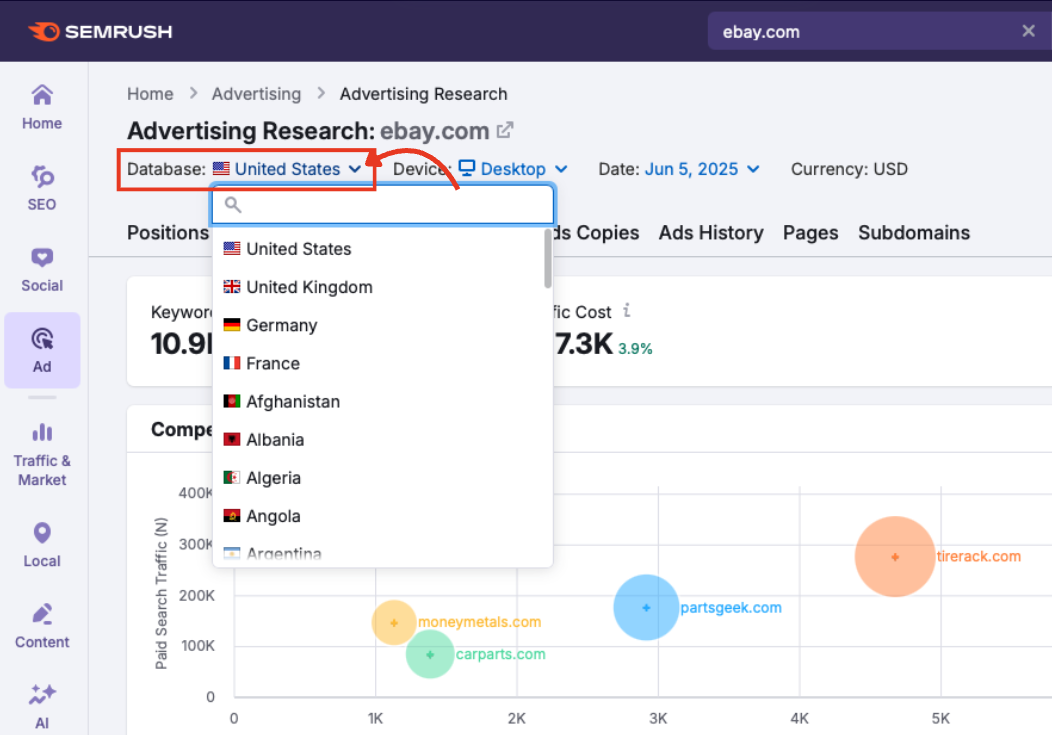
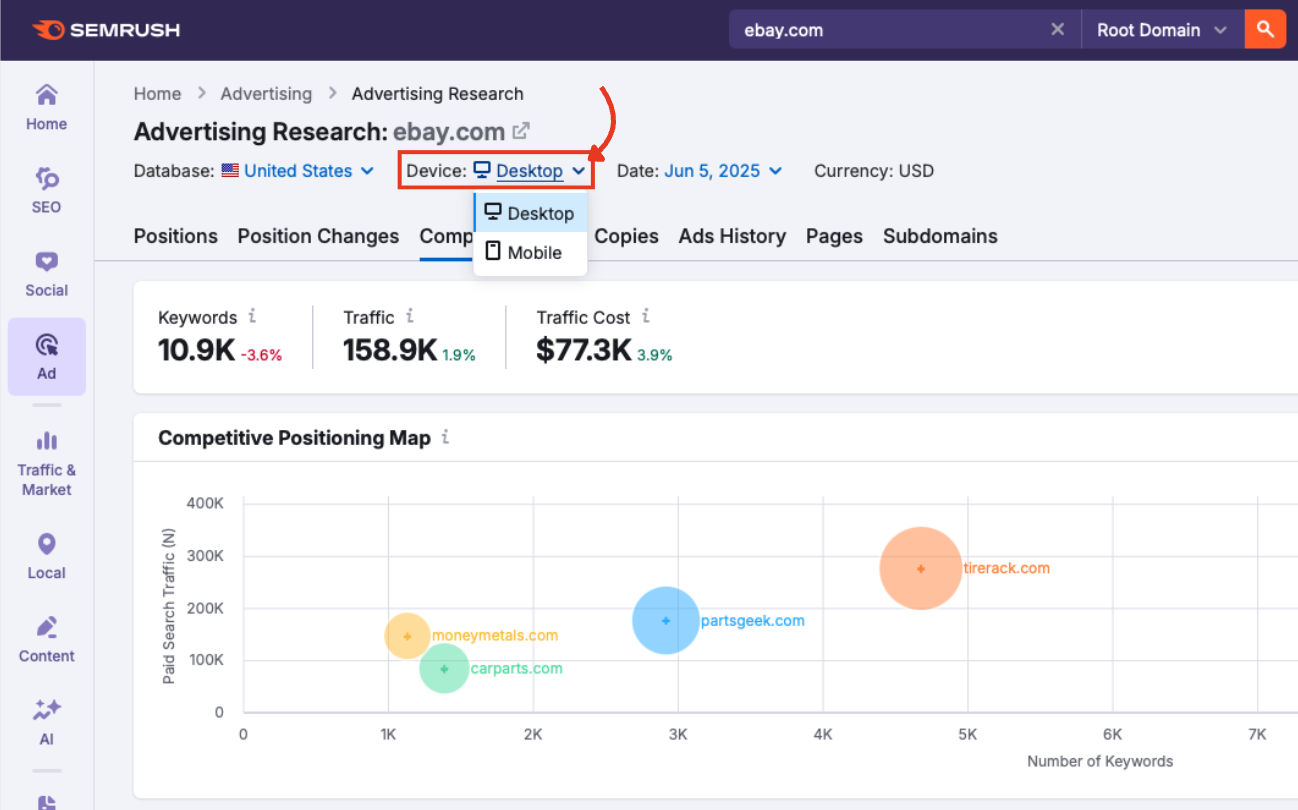
Device
Switch between desktop or mobile data.
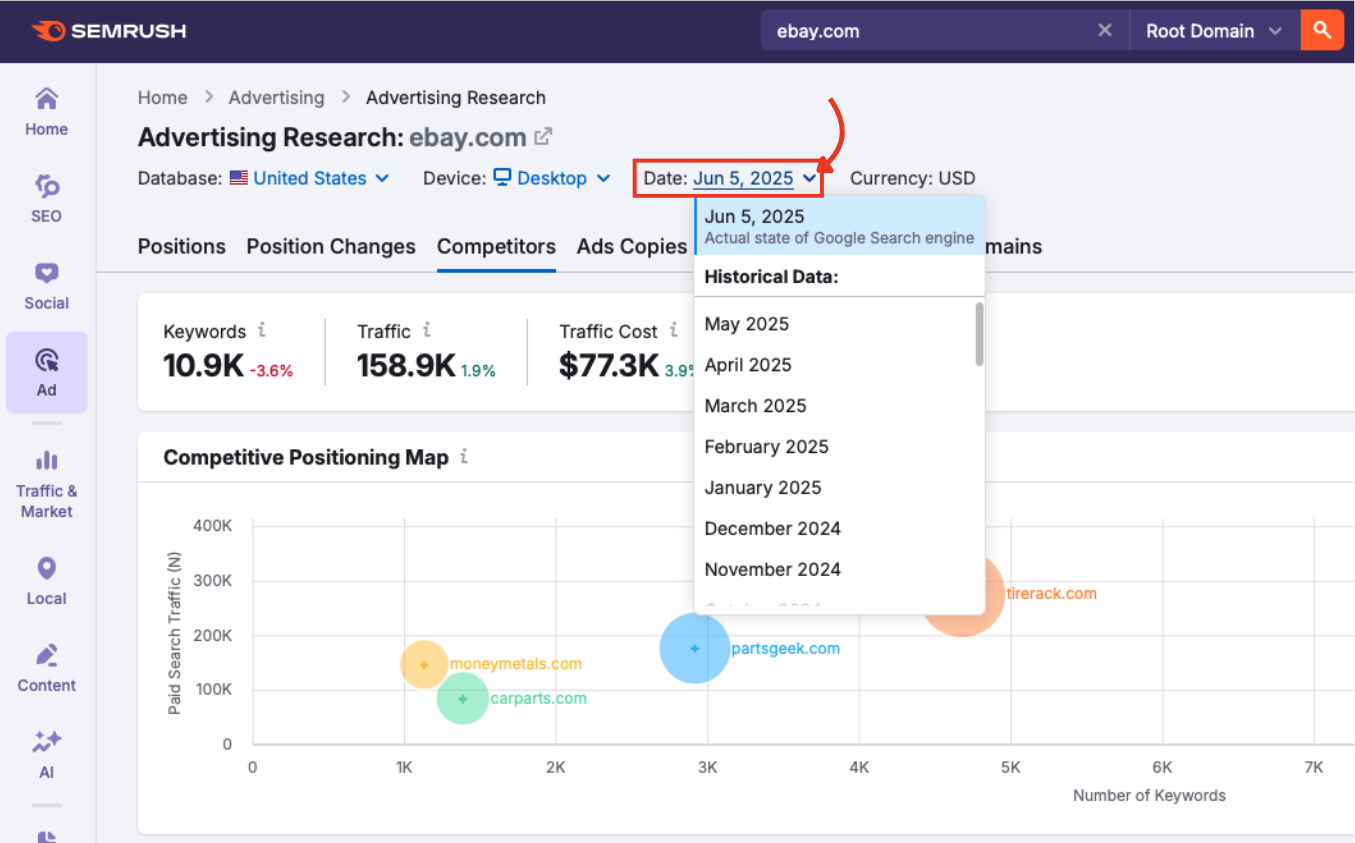
Date
Pick a time period to analyze. You can go back as far as January 2012.
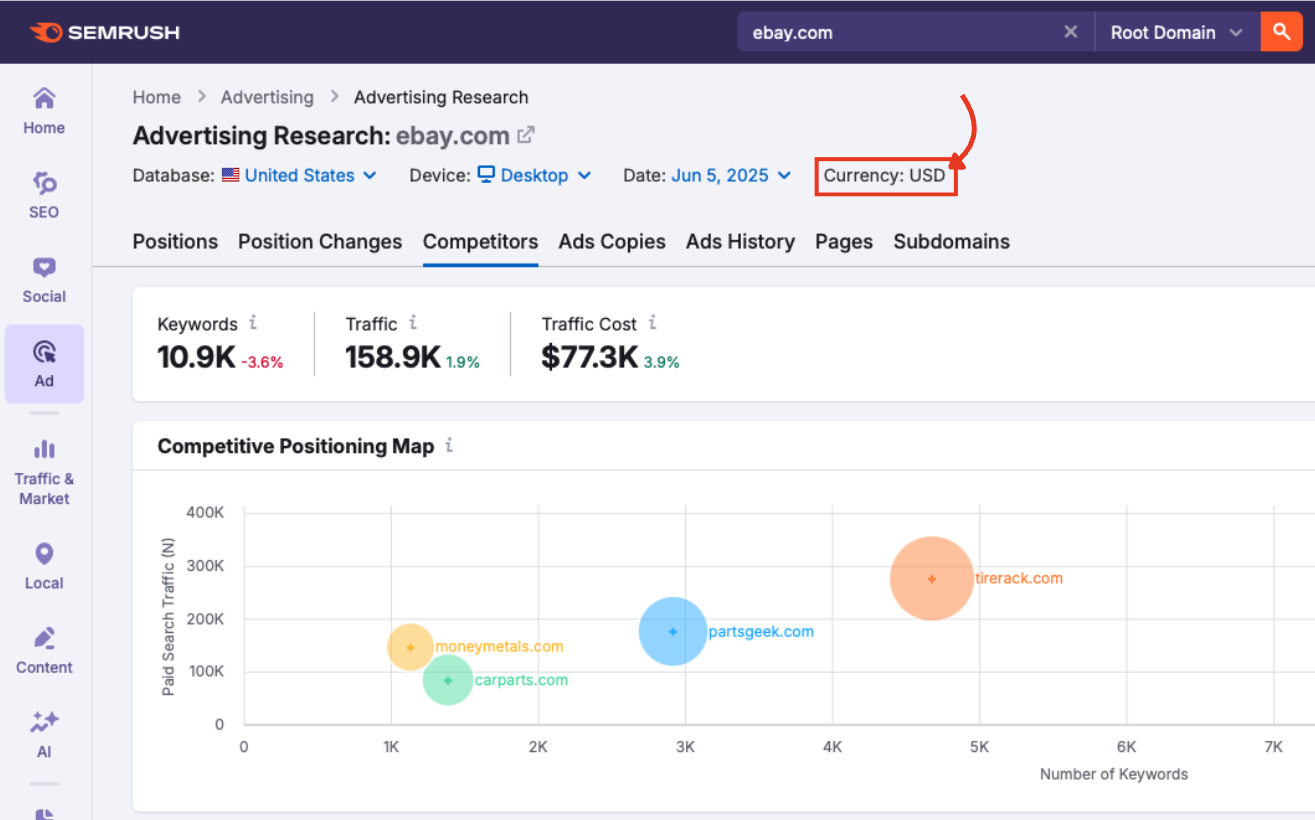
Currency
Controls how CPC and cost metrics are displayed (linked to the country database).
Step 2: Take a Quick Pulse with Three Key Metrics
Before diving into the graph and table, take a look at the three primary metrics summarizing your competitor’s paid search footprint.
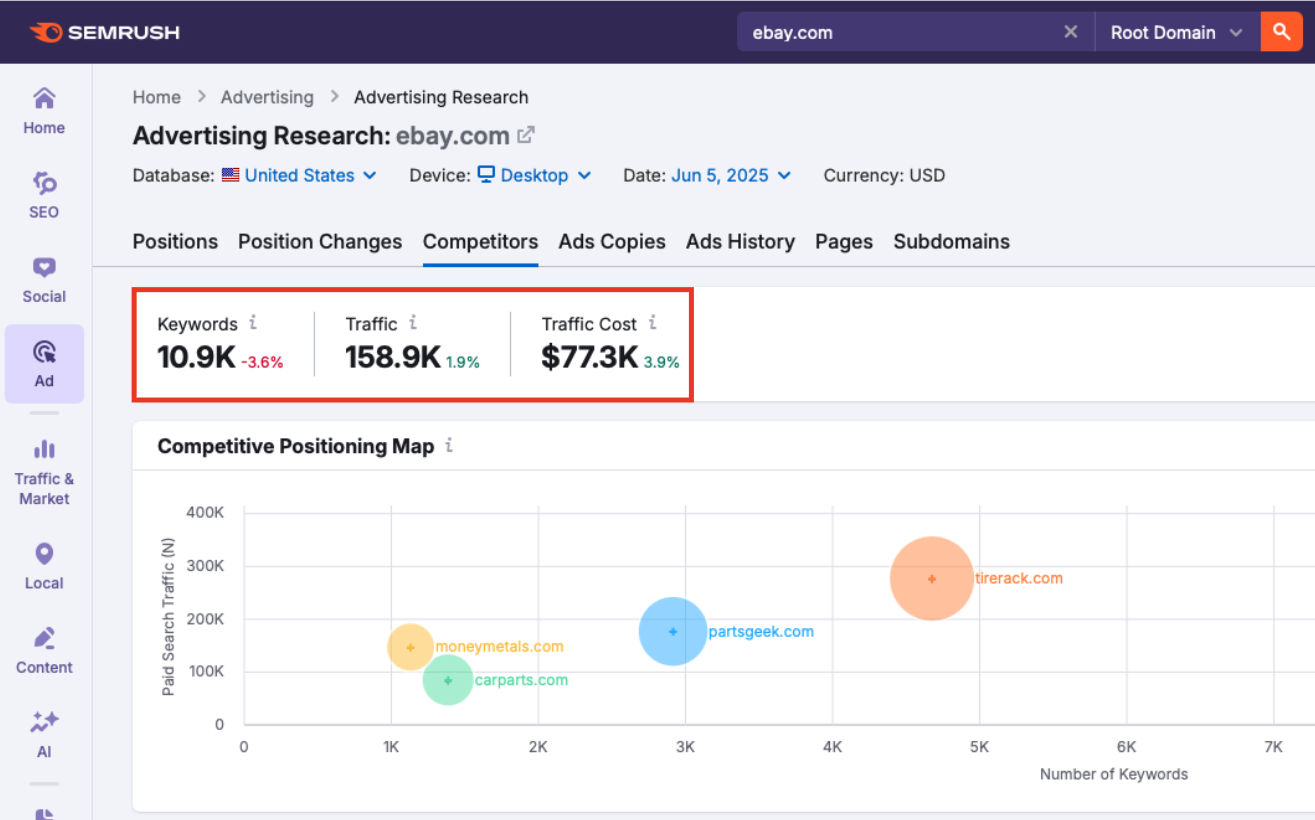
- Keywords: The number of paid keywords the domain is currently ranking for in Google Ads. A higher count suggests broader keyword coverage.
- Traffic: Estimated clicks generated from paid ads over the selected time period. This gives you an idea of how much visibility the domain is earning.
- Traffic Cost: Estimated spend required to achieve that level of traffic, based on CPC rates. Use this to gauge how aggressively the domain is investing in Google Ads.
Step 3: Visualize Your Competitive Landscape
The Competitive Positioning Map gives you a snapshot of the advertisers competing most directly with your domain based on keyword volume, traffic, and ad spend. Use this view to spot the biggest players, find unexpected rivals, and uncover gaps in your strategy at a glance.
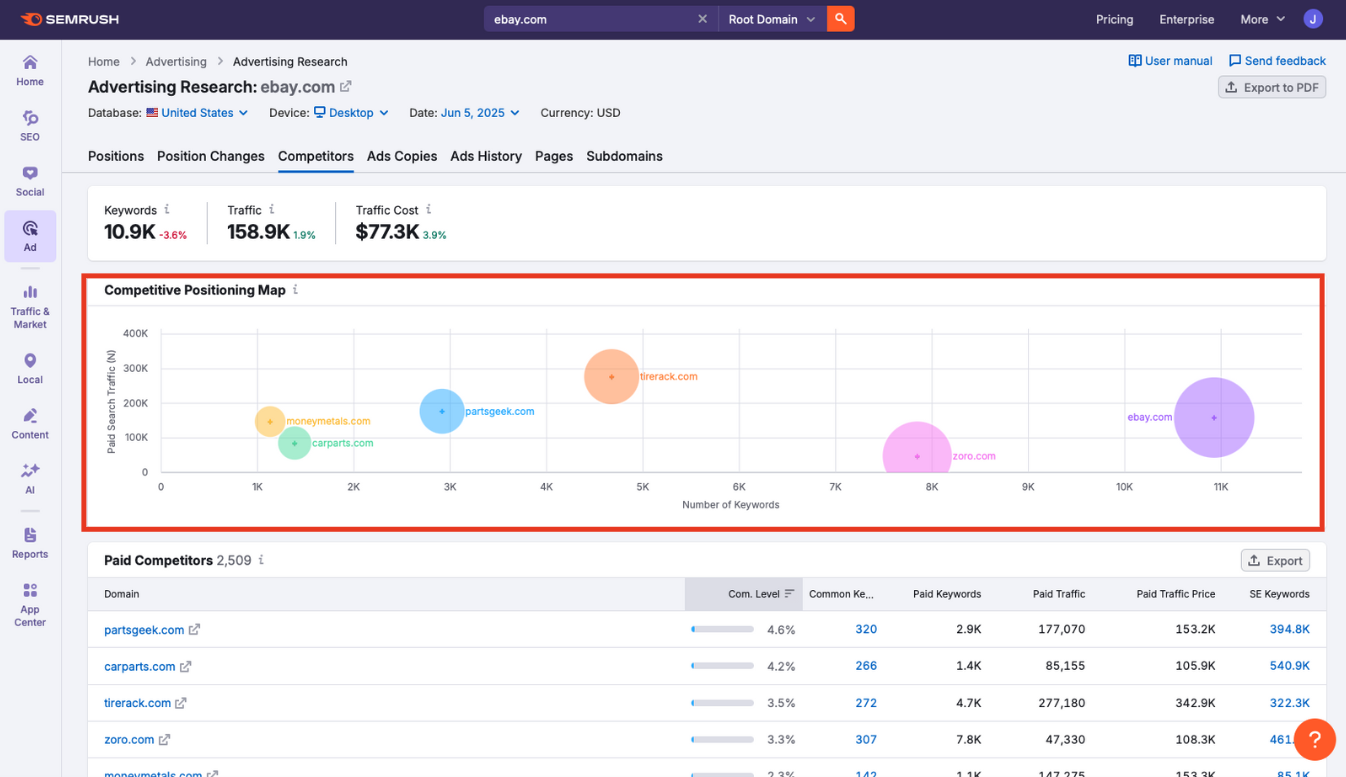
This bubble chart plots domains based on the following dimensions:
- X-axis: Number of paid keywords
- Y-axis: Estimated paid traffic
- Bubble size: Estimated traffic cost
Hover over a bubble to view more details.
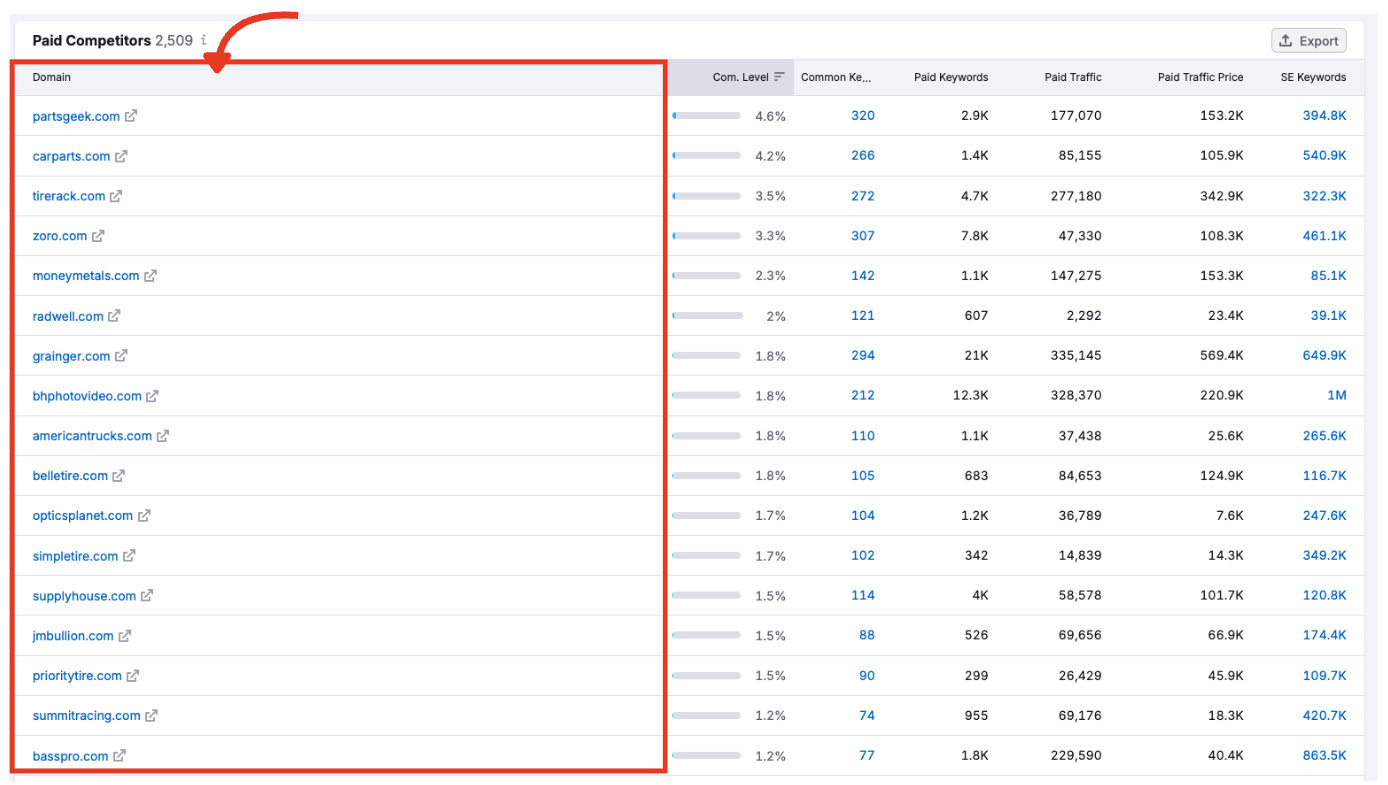
Step 4: Break Down Competitor Insights in the Table
Scroll below the graph to find the Paid Competitors table. This is where the real detail lives. Each row shows a competing domain and how closely it aligns with your own in terms of paid keyword strategy.
Let’s go column by column:
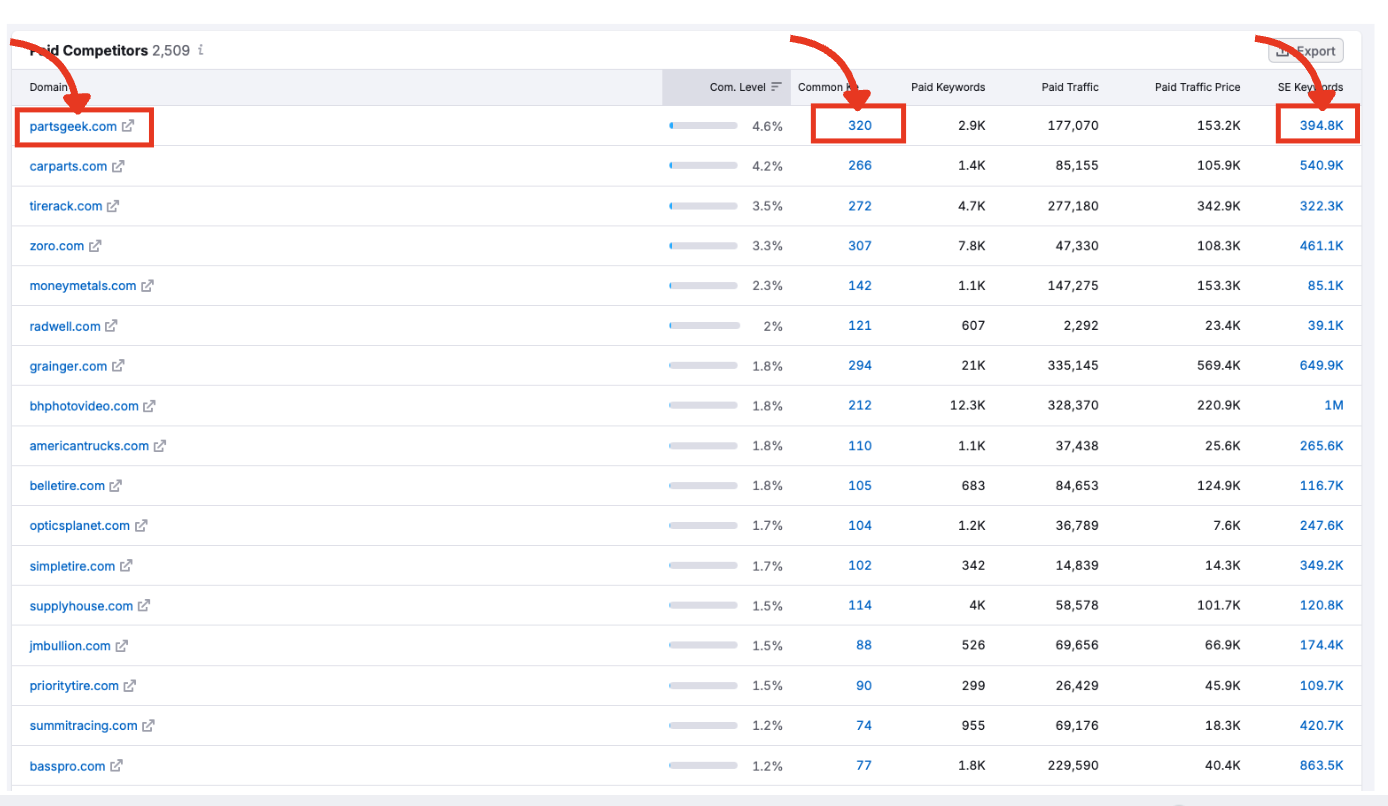
Domain
The competing website bidding on overlapping keywords. Click the domain name to open the Positions report for deeper research or the arrow to view the website itself.
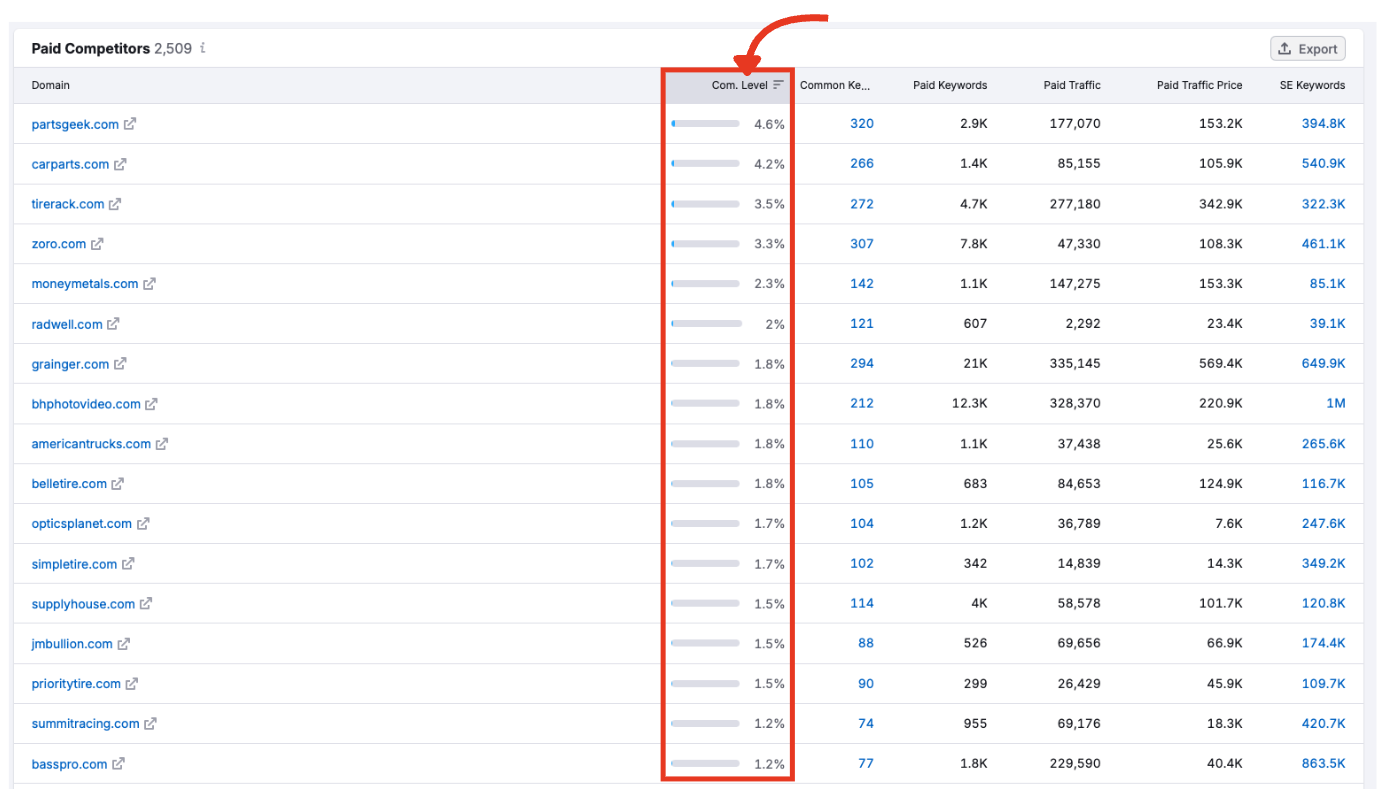
Com. Level (Competition Level)
A percentage score showing how much keyword overlap exists between your domain and theirs. Higher scores mean tighter competition for the same terms.
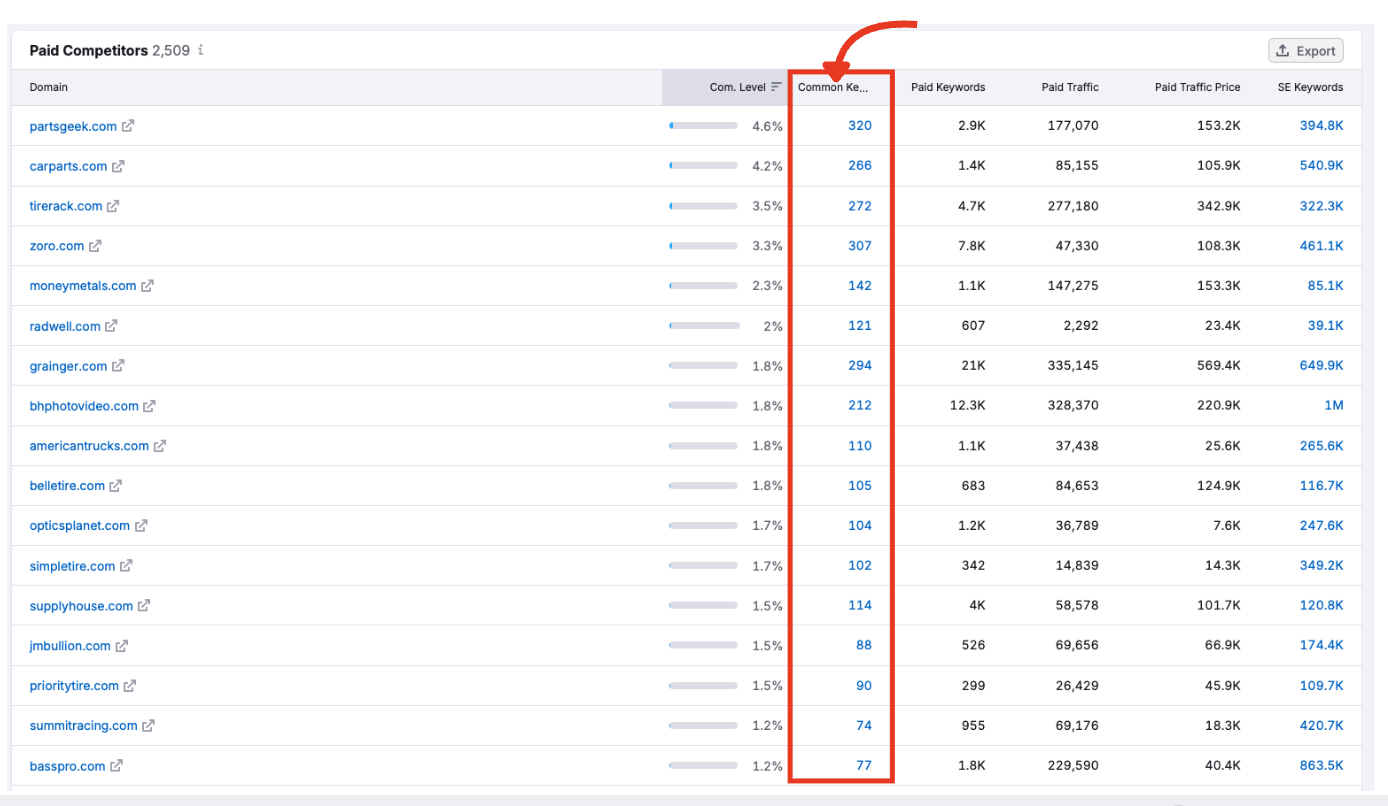
Common Keywords
The number of paid keywords that both domains are targeting. Click this number to launch the Keyword Gap tool and compare strategies side-by-side.
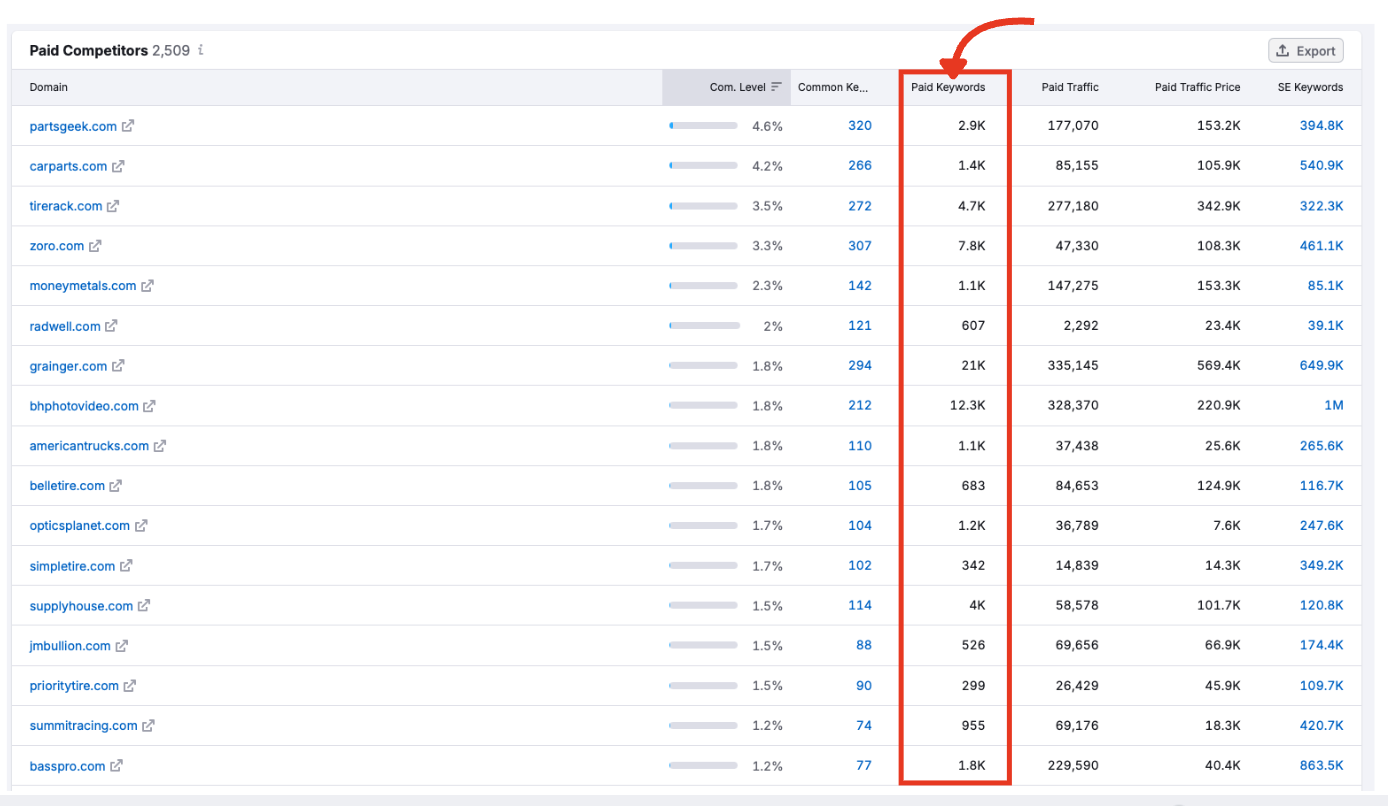
Paid Keywords
The total number of keywords the competitor is bidding on.
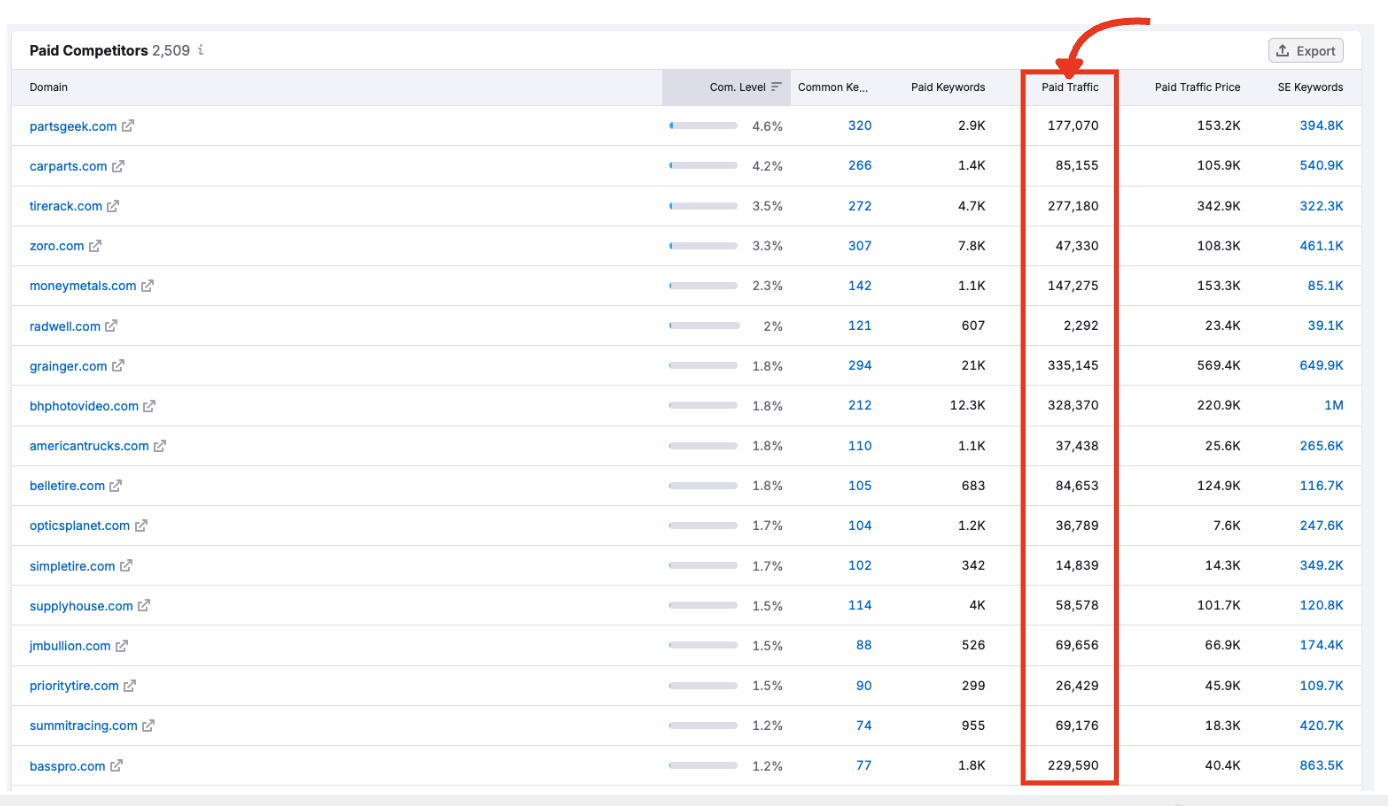
Paid Traffic
An estimate of how many monthly clicks that competitor earns from paid search. Use this to gauge their visibility in Google Ads.
Paid Traffic Price
The estimated cost to generate that traffic through Google Ads. Higher numbers suggest aggressive bidding or high-CPC keyword focus.

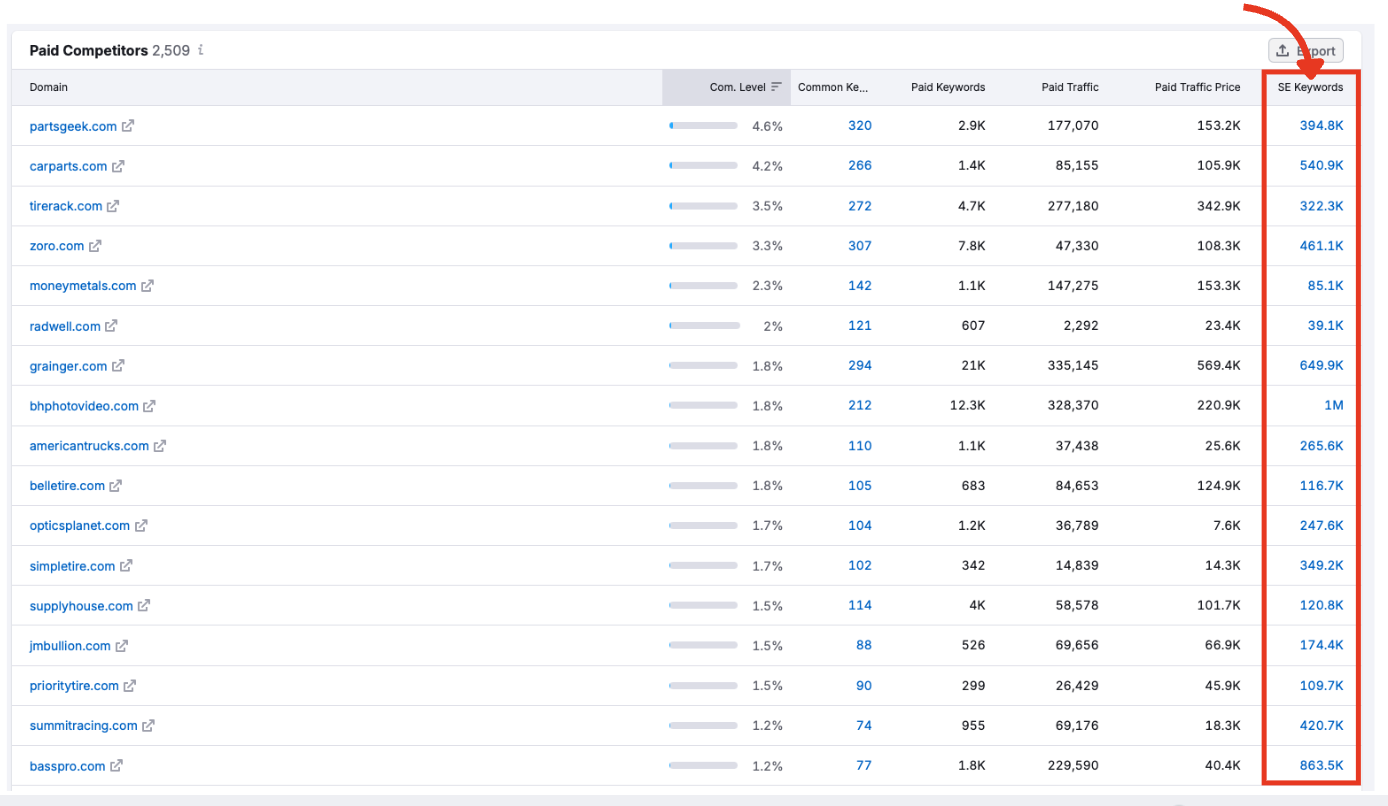
SE (Search Engine) Keywords
The number of keywords the domain ranks for in organic search. Click this number to jump to their Organic Research report.
How to Use This Table
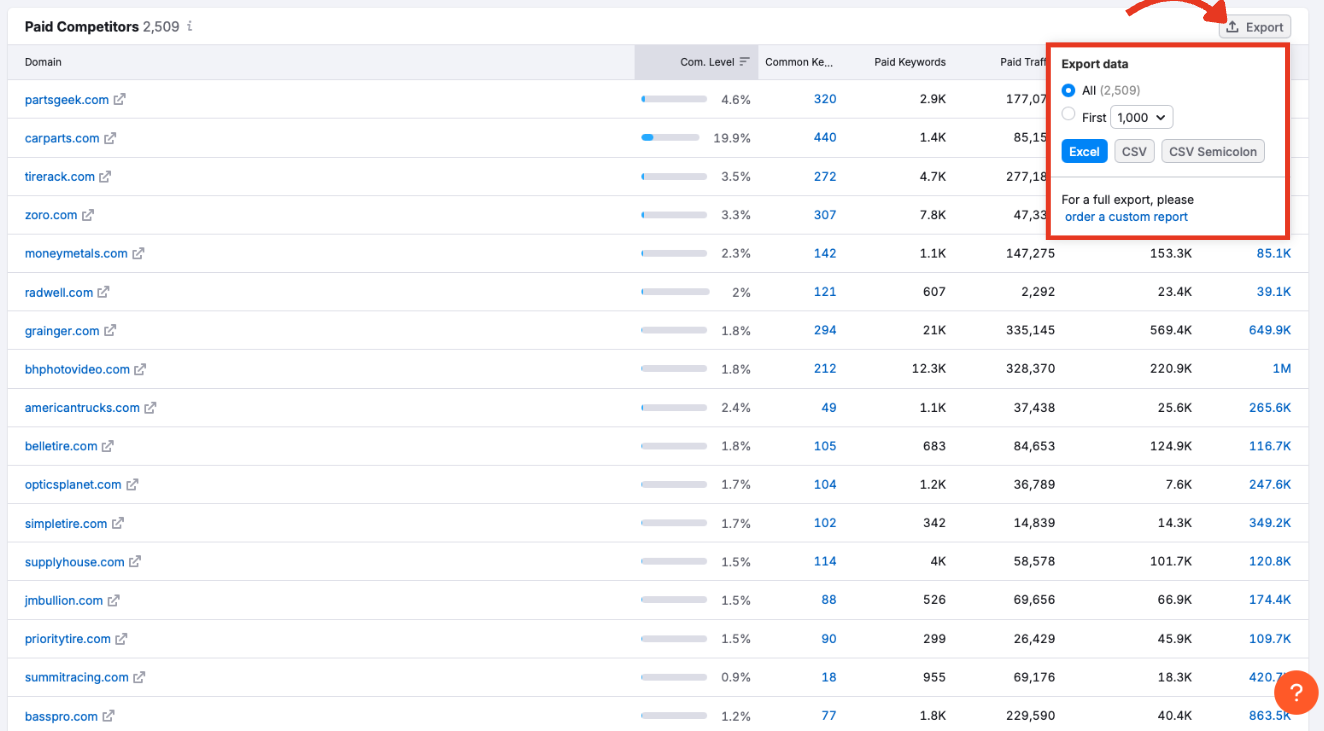
- Sort by any column to prioritize what matters most: keyword overlap, traffic, or budget

- Click any blue link to explore more detailed competitor data across Semrush tools
- Export the table to analyze further or create a report
From Competitors to Campaign Strategy
Once you've reviewed your top paid search rivals in the Competitors tab, the next step is the Ad Copies report. This tab shows exactly what kind of creatives and messaging your competitors are using, helpful for drawing inspiration for your next campaign.
Continue exploring the Advertising Research toolkit in whichever order fits your needs:
- Positions: See where a domain ranks for each paid keyword
- Position Changes: Track when keywords are added, lost, or move in the rankings
- Ads History: View historical ad activity over time
- Pages: See which landing pages receive the most paid traffic
- Subdomains: Discover how visibility is distributed across subdomains
Each report has its own step-by-step manual. Work through them chronologically or jump straight to the insights most relevant to your strategy.
For a complete look at your paid ads performance, try all the tools within the Advertising Toolkit and start optimizing.